At Skroutz we rely heavily on web analytics for key business and technical decisions. Data gathered from web page views are the raw material used for calculating product conversion rates for shops, extracting business intelligence, making personalized suggestions and forecasting.
As incoming web traffic kept growing steadily during the past years, we faced certain challenges that prompted us to redesign a crucial part of our business: our web analytics tracking infrastructure.
Web Analytics Tracking 101
Gathering data from web analytics typically involves using web beacons, which is a fancy name for invisible images injected in the HTML markup.
An example beacon could be the following:
<img width="1" height="1" src="https://www.scrooge.co.uk/track?foo=bar"></img>Such a snippet would have to be added in the pages we want to track. Then, each
time a web browser fetches one of those pages it will also attempt to fetch the image
by making a request to www.scrooge.co.uk/track?foo=bar.
This request will be served from our servers which will grab the tracking data
from its query string.
In this case the query string is foo=bar. These are the raw data that, after
conversion to a format more convenient for processing, are persisted by our
application to some kind of storage for later consumption.
This is essentially how Google Analytics works and how web analytics in Skroutz
also works.
This post focuses on the part after the tracking request arrives to our servers and until the data are persisted for further analysis.
Legacy
The legacy implementation was fairly straightforward and mostly involved our main Rails application.
- Tracking requests are served by our main Rails monolith running on Unicorn. This is the same application that serves all regular user traffic (e.g. https://www.scrooge.co.uk/c/165/mobile_phones.html).
- We currently operate in three countries, each with its own deployed instance of the application (we call these flavors). There’s www.skroutz.gr in Greece, www.alve.com in Turkey and www.scrooge.co.uk in the United Kingdom. Each instance has its own application servers, databases and other infrastructure.
- The query parameters of incoming tracking requests are converted to JSON objects. For example
?foo=baris converted to{"foo":"bar"}. - The JSON objects are then persisted to log files on the disk and to Kafka topics, using blocking calls. (Logs were the original storage until Kafka was added to the mix. This redundancy is an intermediate situation until we completely transition to Kafka. Until then both storages are equally important, since there are applications relying on either of them.)
- Memcached is used as a shared storage between Unicorn workers for performing sanity and error checks.
All of the above take place within the HTTP request lifecycle: a browser
requests /track?foo=bar and after the data are persisted to both log files and Kafka,
the response is sent back to the client.
The flow is illustrated in the following diagram and the infrastructure is also described in “Skroutz infrastructure at a glance”.
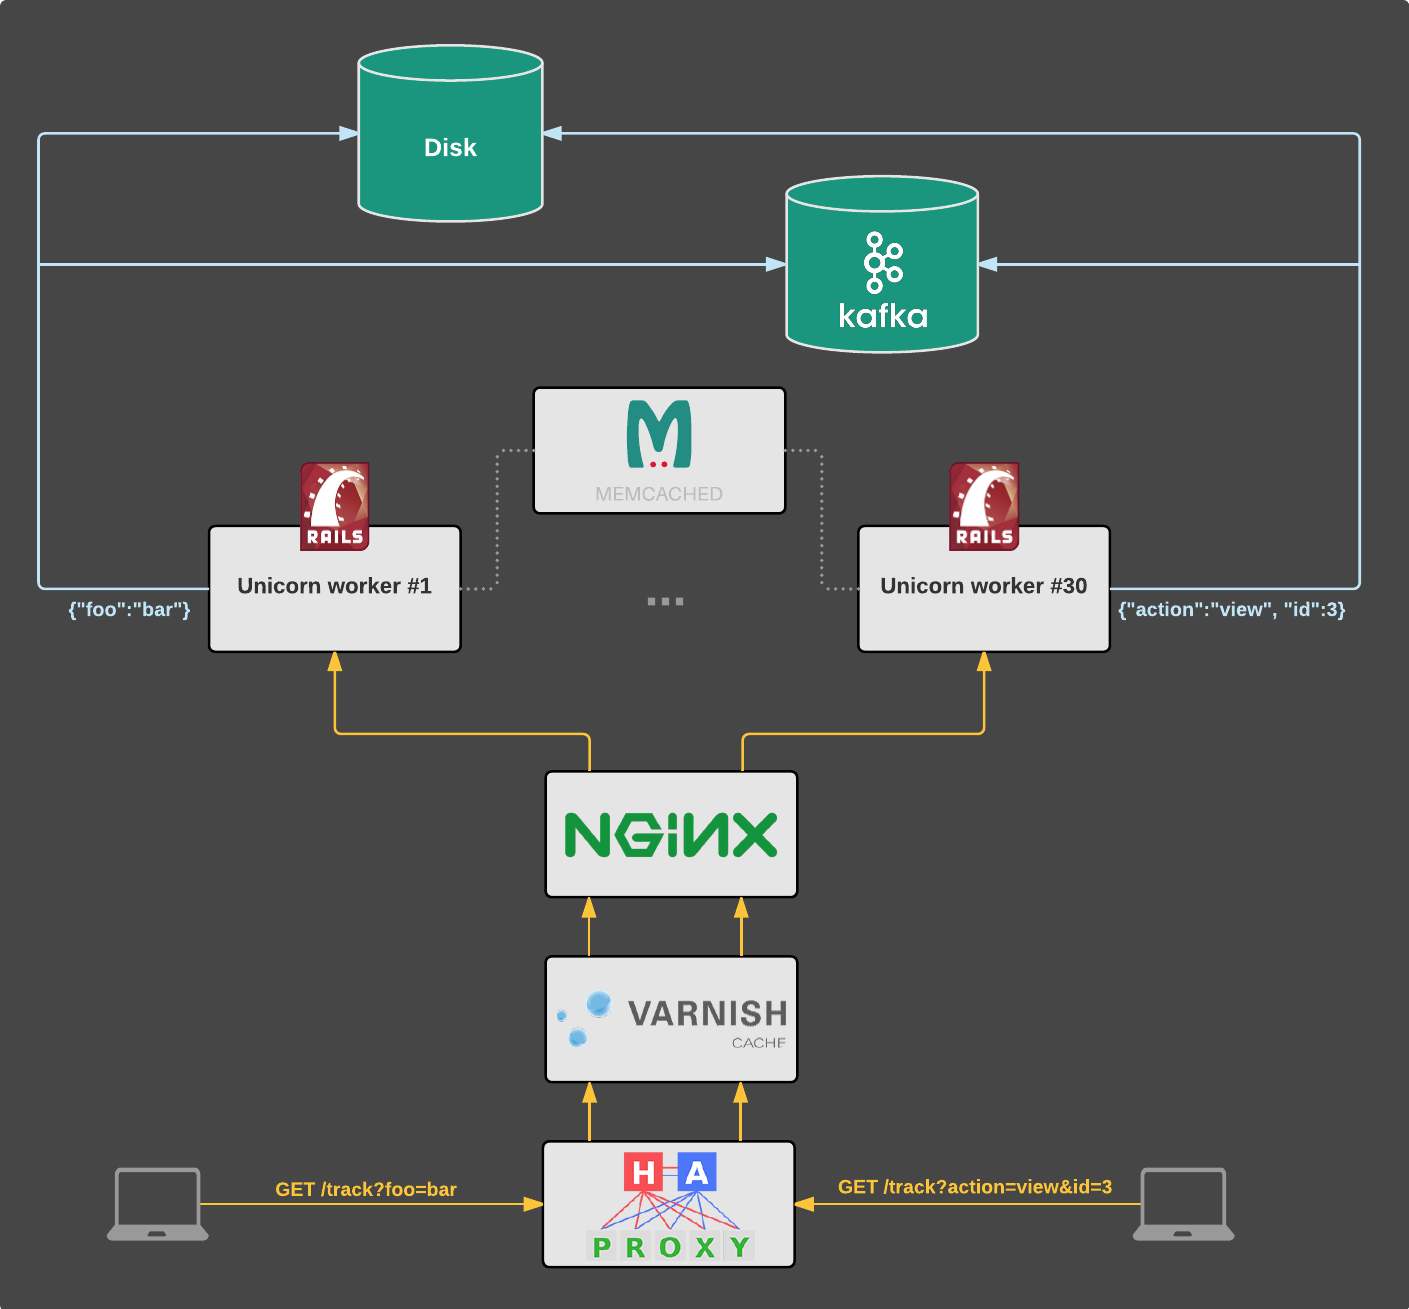
A similar setup serves www.alve.com and another one serves www.scrooge.co.uk.
While this solution served us well for several years, incoming traffic was constantly growing and we begun being disconcerted as we knew there were certain issues lurking.
Motivations: why bother?
The most critical problem was that tracking requests could cause a downtime in the application that served regular user traffic. This is a direct consequence of the following facts:
- Each page view results in a subsequent tracking request.
- Tracking requests are served by the same application and servers that serve regular user traffic (e.g. page views, API calls).
- Persisting data to Kafka and log files are performed within the tracking request lifecycle using blocking calls.
- Each Unicorn worker can serve one client at a time.
This meant that a hiccup or even worse, a failure in one of the storages (i.e. Kafka, NFS) could result in tracking requests quickly occupying all the available Unicorn workers. No workers left to serve other clients means effectively downtime in the application.
This was bad. Our user experience could suffer because of an issue in our web analytics tracking infrastructure.
On the software architecture side of things, there was unnecessary coupling of the main application to what was arguably a tracking service. While the application is generally deployed multiple times a day, the tracking logic changed only a few times in years. This resulted in developers being reluctant to change things that could somehow affect the tracking path (e.g. upgrading the Kafka driver).
Furthermore, requests were unnecessarily traveling through the whole Rails/Rack stack resulting in wasted resources and capacity in the application servers.
On top of these issues was also the fact that no robust Ruby Kafka drivers exist. We used the most promising ones yet encountered many critical bugs and, while we fixed some of them, others required a major rewrite.
Clearly it was time for an overhaul. We decided to step back, rethink the problem and come up with a better, long-term solution.
Architecting the new system
One of the first questions that popped up was “What if we extract the tracking logic to a separate service?”
Assuming we did so, a failure in the tracking path would not hurt user experience since a downtime in the tracking service wouldn’t result in downtime in the main application as well.
It made sense. After all, the code for gathering web analytics need not be coupled with the code of the main Rails application. The tracking part could be viewed as a self-contained system that receives HTTP requests as input and produces JSON objects as output.
Furthermore, a service decoupled from the main application means that it could be multitenant: a single instance could serve all of the traffic to skroutz.gr, alve.com and scrooge.co.uk.
The new system should be reliable, maintainable, able to handle thousands of clients efficiently and scale with our traffic. With those requirements in mind, we could make an informed decision on which tool we should use.
Picking the right tool
Being heavy users of Ruby, it was naturally the first option we considered. However we knew that writing a scalable, highly-concurrent system on top of MRI Ruby would be an almost impossible task. Even if we did, the result would be less than optimal, since there’s not built-in concurrency support from the runtime (plus there’s a global VM lock) and the garbage collector would be a major obstacle.
The next option was Go. We always liked the language and its philosophy made much sense to us. It seemed like an ideal candidate due to the following:
- Built-in concurrency support.
- Simplicity: Any developer could pick up the project quickly. The codebase would be easier to maintain.
- Solid standard library: We could use less external dependencies which would lead to a more reliable and maintainable system.
- Excellent tooling: Tools like the data race detector, the execution tracer,
pprof,
go vetandgofmtare a huge advantage when building such a production system. - Documentation: The language is easier to work with, when good documentation exists.
Overall, Go seemed like the right tool for the job.
scratchd: The new implementation
The name scratchd is short for “scratch daemon”, since the aforementioned log files were historically called “scratch logs”.
The new implementation is essentially an HTTP server and two work queues, one for persisting data to log files and one for persisting data to Kafka topics. We call the queues “backends”, goroutines that run concurrently with the HTTP server and are responsible for persisting the data.
The core entity which is passed around in different channels is Line:
// Line corresponds to an incoming tracking request and contains the data
// to be persisted.
type Line struct {
        // Flavor specifies the instance to which the request corresponds to
        // (e.g. scrooge.co.uk).
        Flavor *Flavor

        // Values are the query parameters encoded in JSON.
        Values []byte

        // Time is the flavor-aware time the request was received.
        Time time.Time
}
The definition of a backend is the following:
// Backend consumes Line values and persists them to some kind of storage.
type Backend interface {
        // Consume starts the processing loop of the backend
        Consume()

        // Input returns the channel on which the backend receives Line values
        Input() chan<- Line
}
Each incoming request results in a new Line value which is then
passed to the backends. The flow is illustrated in the following diagram:
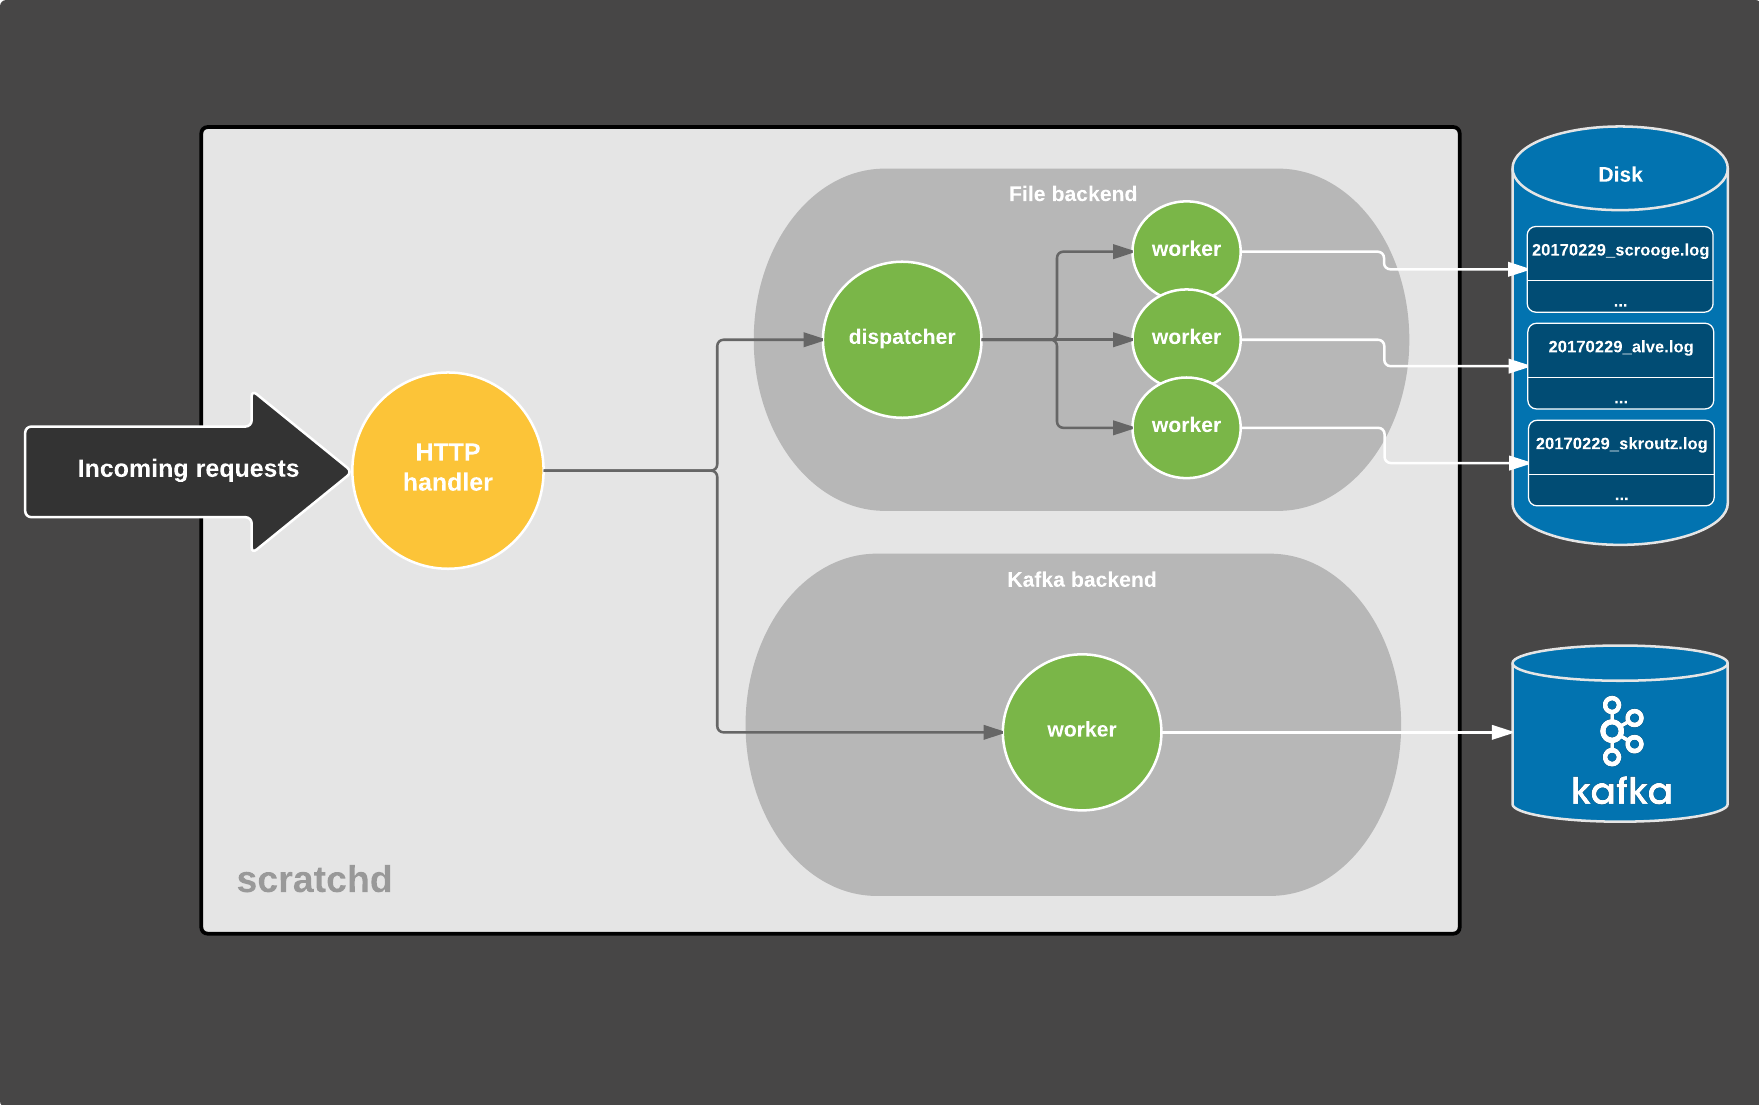
Each circle is a separate goroutine, gray arrows represent Line values
being sent over channels and white arrows are data being persisted to some
kind of storage. (There are actually more moving parts that were taken out
for the sake of simplicity)
The process of an HTTP request lifecycle is the following:
- A tracking request comes in and is processed by the HTTP handler which
performs the following tasks:
- sanity/error checks on the request and exit early if it’s malformed
- converts the query parameters to JSON
- creates a
Linevalue and sends it to the backends for persistence, via buffered channels - responds to the client
- Meanwhile each backend runs concurrently and consists of a tight loop (the
dispatcher) that receives
Linevalues from a channel and persists them accordingly.- The File dispatcher writes the data to files via separate worker goroutines. Each worker is responsible for writing to a certain file (there is a file per-flavor, per-day).
- The Kafka backend consists of a single worker that persists data to Kafka. Since it’s backed by librdkafka which maintains its own buffers and uses multiple I/O threads under the hood, there’s no need for further concurrency in the Go space.
On a high level, the system consists of three main components running concurrently and communicating via channels.
There are various advantages of this approach:
- First and foremost, persistence backends are decoupled from each other. A failure in Kafka won’t have an impact in the log files, and vice-versa. A consequence of this is that if for example, data are missing from log files due to a failure, we can re-produce them using the Kafka topics.
- The HTTP path is completely unaffected by any failures in the backends: if a backend is down, we’ll get notified but users won’t notice a thing.
- The channels being buffered means that we are more resilient against any kind of hiccups (network, Kafka, filesystem) as the jobs will get buffered for a while and eventually get processed by the respective backend.
The obvious choice for a Kafka driver was Sarama,
being the most popular that currently exists. However we went with the newer confluent-kafka-go since we’re heavy
users of the excellent librdkafka, which from our
experience is the most robust Kafka driver implementation.
Leveraging librdkafka means the driver usually gets bug fixes and new features quicker than
the alternatives.
The use of Memcached was replaced by a custom in-memory key-value store, implemented in a few lines of code and supporting simple GET/SET operations, TTL-expiration and only strings as keys/values. While there were other cache implementations available, they provided more features than we needed and were more complex consequently.
As far as configuration is concerned, we considered YAML, TOML and JSON. We went with the simpler choice, JSON, due to the fact that there’s an implementation in the standard library. We somewhat balanced the reduced human readability with thorough documentation in the source code.
For logging we used the standard library’s Logger with prefixes corresponding
to each component (http, kafka, file). The output is collected by journald which
then forwards it to syslog. We may consider
logrus in the future (the Sentry integration
is nice), although we’re not sold on it yet.
Testing
Apart from unit tests, we mostly use integration tests: spin up the server, send a user request to it and verify the output is correct. In case of the File backend, we verify that the log files generated during the tests are correct. Likewise we use a dedicated Kafka cluster for verifying the output of the Kafka backend by consuming the relevant short-lived topics.
Doing this was fairly straightforward using goroutines and the testing framework of the standard
library: call main() in a separate goroutine and issue client requests from
TestMain().
We haven’t used any external libraries for testing, as the testing package
was pretty much what we needed. We make heavy use of reflect.DeepEqual for comparing expected/actual results and the %#v modifier when printing
test failures. Finally, table-driven tests greatly simplified the actual test code.
In order to make sure we didn’t introduce any regressions, we replayed a large sample of production requests against the old and the new implementation and verified that the results were identical.
Zero-downtime deployments
Deploying without losing any traffic was a hard requirement. This was previously handled by Unicorn and involved custom shell scripts that sent signals to control a couple of Unicorn processes. The process was similar to the one used by nginx.
In scratchd we leverage systemd’s socket activation
and let it do the weightlifting. This way we didn’t have to implement the
signal handling logic that Unicorn and nginx do,
plus we got rid of the shell scripts. The go-systemd
package made this a breeze. The process is just a matter of binding and listening to a socket
provided by systemd instead of creating a new one.
We also leveraged the graceful server shutdown feature that was added in Go 1.8, since we didn’t want to forcefully close in-flight connections during deployments.
Zero-downtime restarts means zero-downtime upgrades too, since upgrading is a matter of replacing the on-disk binary and restarting the systemd service.
Monitoring
Apart from the mandatory Icinga and Munin monitors, we use Grafana backed by Graphite. The service provides an HTTP stats endpoint that exposes various metrics some of which are:
- Number of jobs buffered in each backend
- Number of persistence errors in each backend
- Number of malicious/malformed requests
- Runtime metrics via
runtime.MemStats(GC cycles/pause times, memory allocations etc.)
The service maintains a global map of counters that are concurrently updated
by various writers (i.e. backends, HTTP handler), therefore we make heavy use
of sync/atomic, which is not ideal but
the situation will get better since a concurrent map
will be shipped in the standard library with Go 1.9.
A script scheduled in cron periodically gathers the metrics exposed by the stats endpoint and feeds them to Graphite.
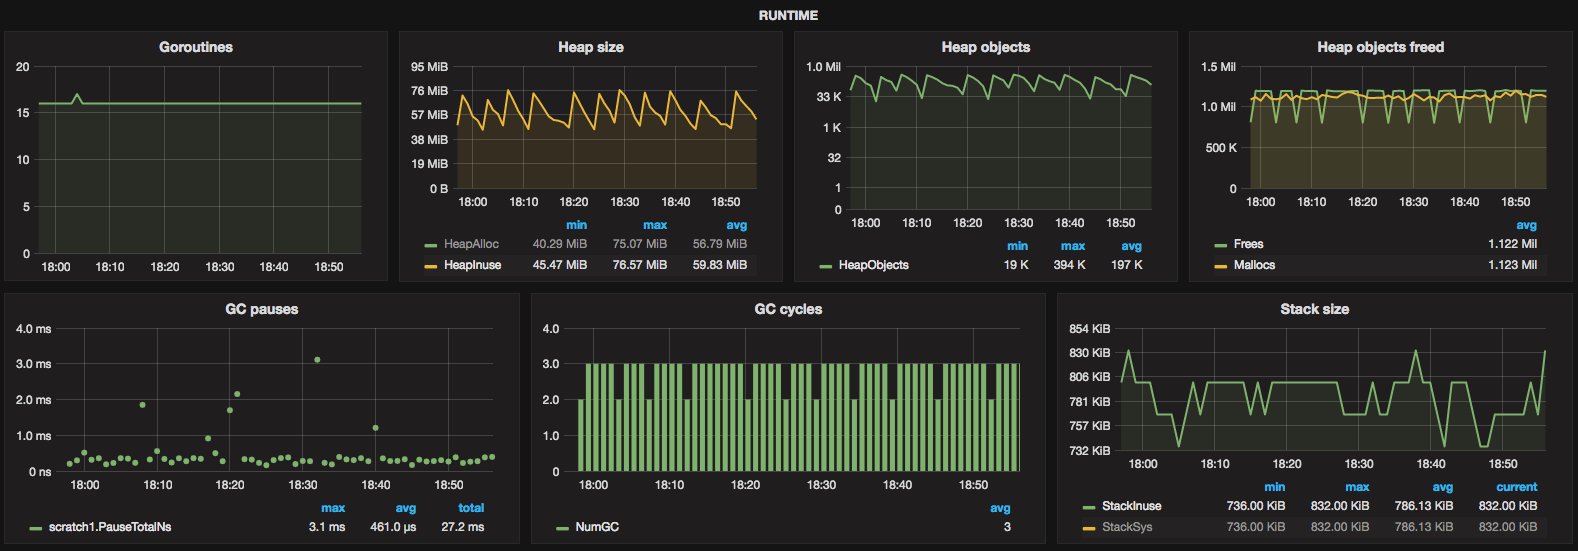
The rollout
We are heavy users of Debian so shipping scratchd as a Debian package made much sense in our case. So we did. Installing the service is as simple as running:
$ apt-get install scratchdThis makes sure all the dependencies are taken care of (i.e. librdkafka) and also ships a default configuration file and the respective systemd unit files. Upgrades are a breeze too: upgrade the package and restart the service.
During the initial rollout we leveraged the fact that HAproxy was deployed in front of any backend services, proxying requests to them. Initially we only directed traffic originating from our internal headquarters network to scratchd. After verifying everything was working as expected, we proxied a small portion of real user traffic, while leaving the majority served by the legacy implementation (the Rails application). Then again, provided everything was fine, we gradually increased the amount of traffic to the new service until no tracking requests hit the previous implementation anymore. This strategy helped us minimize potential issues that could arise (there were none).
Apart from that, there was no reason to use nginx or Varnish anymore, so we got rid of them. The new stack was now reduced to the following:
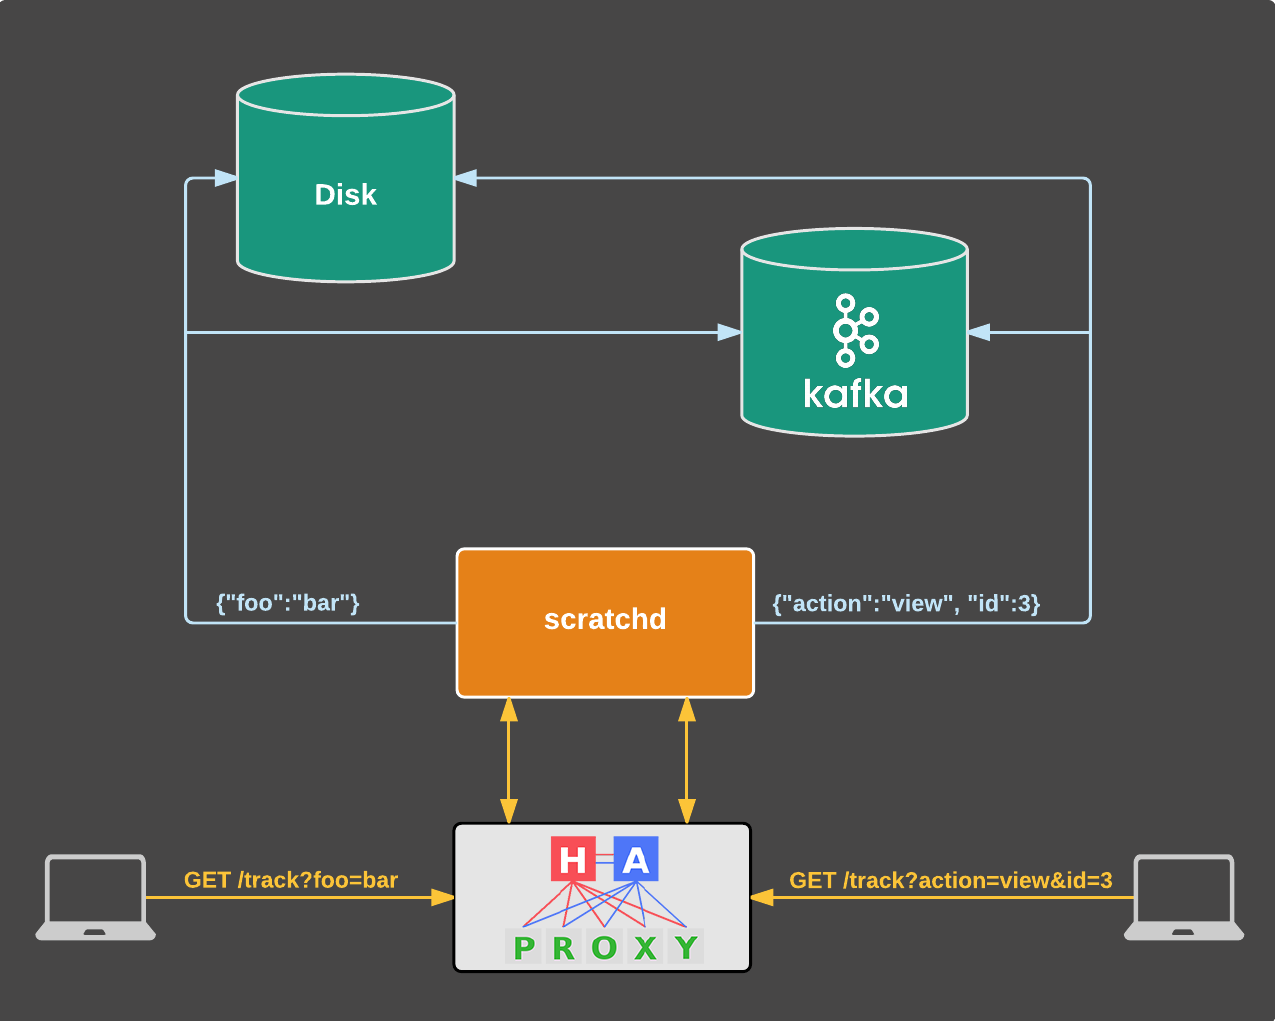
In case of a failure in the primary instance, there’s also a secondary that HAproxy will automatically redirect all traffic to.
The results at a glance
The new solution seamlessly solves our previous issues and also brings additional benefits:
- Web analytics tracking path doesn’t have any impact to the main application any more. A Kafka or a filesystem failure will not result in downtime for users browsing www.skroutz.gr, www.alve.com or www.scrooge.co.uk.
- Persistence backends are decoupled from each other, which means that a failure in Kafka won’t impact log files, and vice-versa.
- Resiliency: We are more tolerant to various hiccups. Incidental network latencies or Kafka rebalances means that writes will be buffered for a while and will get flushed eventually. The same holds true for log files.
- Efficiency: A single instance of the new service is deployed on a thin VM, takes care of all the traffic (currently coming from three countries) with a 60MB memory footprint and negligible CPU utilization. Our Unicorn workers now have more resources to serve web page requests. Furthermore, writes to Kafka and disk are now buffered so there’s less overall pressure.
- Multitenancy: This greatly reduces operational costs since we deploy a single instance, monitor a single service, perform a single deploy, update the configuration in a single place etc.
- Maintenance: The new stack is simpler than before, which included Unicorn, Rack, middlewares, Rails, nginx, Varnish & Memcached. Now there’s just the standard library, two thin external packages and HAproxy. Fewer layers in the new stack means debugging also gets easier.
- The service can be reused from other front ends (i.e. totally different applications from the main Rails app).
- HTTP/2-ready thanks to
net/http.
When we deployed scratchd though, we noticed an increase in the main application’s response times:
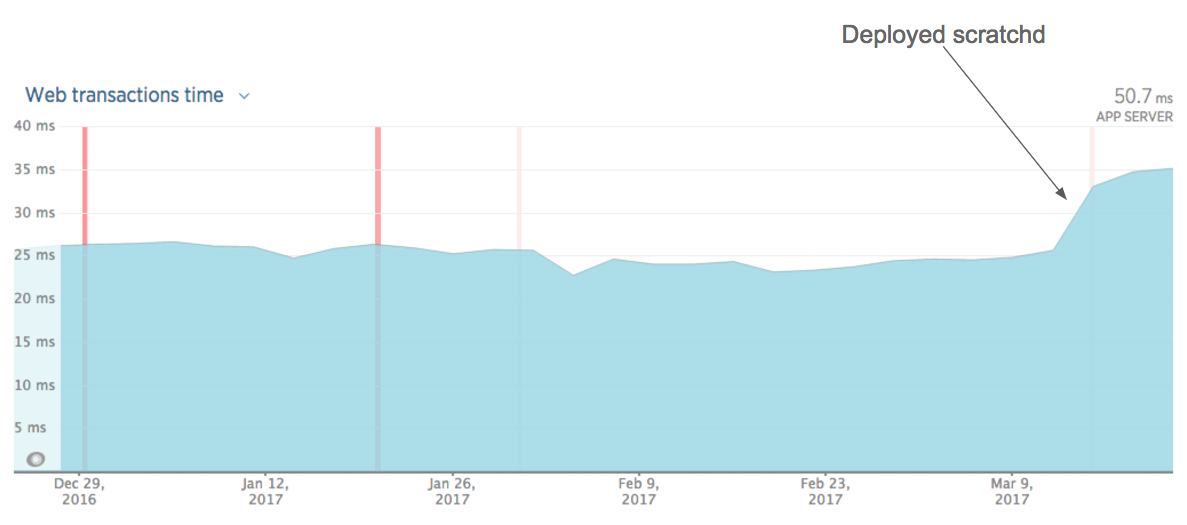
This was expected. Tracking requests were very fast compared to regular web page requests. A write to Kafka and the filesystem was little work compared to multiple database queries, ElasticSearch queries, rendering Rails templates etc. Consequently our NewRelic graphs became a little bit more representative of the actual experience of our users.
Finally, some performance metrics (assuming a single scratchd instance):
- Avg. response time: 1ms
- Current traffic: 7k reqs/min
- Estimated capacity: ~60k reqs/min
- Memory footprint: 61MB
- GC: 470μs avg. pause time, 1.2ms cumulative time over 5min
- Negligible CPU usage
What’s next?
The new approach solved the problems we faced with the legacy implementation and also brought additional benefits. These were not for free, of course, since we paid the cost of the instrumentation that a new service requires (i.e. monitoring, configuration, deployment). This was a tradeoff we happily took though, since we now have a more reliable, maintainable and efficient system.
That said, there is still work to be done. We plan on adding benchmarks, integrating a dependency management tool, making performance improvements, specifying a deployment procedure and establishing some standards that any Go service in our organization should fulfill.
We are very excited to have scratchd running in production. It’s our first step to using Go in production and shed light on how such a system looks like. We explored various approaches and gained experience in how logging, configuration, testing and code architecture are approached in the Go ecosystem and this made us confident in using the language for solving other problems too.