Continuous Integration (CI) is all about reducing the risk of software flaws. It facilitates the detection and resolution of those flaws early during the development process leading in less error prone software. Here at Skroutz, with almost 50 developers working on multiple code streams, with around 22k Ruby and JS Specs to run, and an average rate of ~10 deploys per day, integrating CI logic on our daily development circle is a vital part of our product.
Continuously running our tests
Our test suite mostly consists of unit tests to ensure that our models and methods behave as they should, but we also write functional tests to check the behavior of our controllers. Running the whole test suite locally after each modification on the source code, and trying to keep your testing environment in sync, will definitely reduce the productivity of your engineers. On the contrary, we chose to automate and separate this process on a dedicated environment, in order to be able to detect issues quickly, reliably, and in sync with the rest of the development workflow. When developing new features, we use a dedicated branch per developer and try to always keep the master branch “deployable”. A new push in the developer’s dedicated branch, will trigger a full build of our test suite. Of course, the same approach is followed for each new deployment in the master branch, too. This approach has proven to be very valuable for us at Skroutz. With a big codebase, such as ours, Continuous Integration encourages the developers to deploy new and extensive features in shorter iterations, like our relatively recent Rails 4.0 upgrade, Ruby 2.1.7 upgrade and so forth.
CI Practices at Skroutz
Quite a while ago, we’ve posted about our distributed-testing tool, Kowalski. From 2011, the team has grown, as did the codebase and subsequently our spec suite. The overall tests’ run time has been increased to almost 10 minutes, that is quite a long time to wait in an agile environment.
Builds are meant to be fast. Typically, builds that take longer than ~7-8 minutes to complete, hinder the development process and introduce a bottleneck in the commit rate. This section will provide an overview of the key elements of our CI stack and of all those practices that we’ve followed in order to optimize the build process and achieve a complete run of our test suite in less than 3 minutes.
Overview
Our Continuous Integration setup consists of the following phases:
- A developer pushes a modification in the source code in the respective Git branch.
- A CI server that polls for changes in the repository, triggers a new build run. We use Jenkins CI for that purpose.
- An environment provision tool will prepare the environment in which the tests will run.
- The actual build run will be scheduled. The build’s progress can be monitored in the dedicated Jenkins build page.
- The build’s output will be parsed and feedback will be returned to the person who triggered the build. We have various hooks for that, like Slack, Github notifications, or e-mail notifications.

Environment provisioning
Tests should run in a clean, production-like environment. By production-like we do not necessarily mean an exact clone of the production system, but using at least the same operating system, packages, database software, libraries, or any patches used at the production servers. This way, we ensure that no dependency issues will appear when the code is deployed to production. Spawning such an environment before each build is a time-consuming process affecting the overall build time.
In order to deal with the above issue, we’ve chosen to setup a container-based infrastructure, using Linux Containers (LXC). Containers provide us a thin layer for running our test suite, which is easily manageable, making it an ideal choice for creating short-lived resources. With LXCs, we can also take advantage of several Linux kernel features such as the cgroups functionality without the need of starting a Virtual Machine.
Replicating a production environment in terms of OS, packages, and so forth takes time. To reduce the time of cloning such an environment, we’ve introduced the notion of a master container which is an “exact” replica of our production environment. This master container is updated each night through a cron task to incorporate any changes that happened during the day in production. The master container acts like the source container from where we create thin btrfs lxc-snapshots, which are the actual containers where our test suite is going to run. Even though LXCs are thin, a considerable amount of time is still needed for them to re-spawn their services at each build (remember that we need a clean env for each build). Our approach here, is to take advantage of the idle time between two builds and trigger an LXC prespawn job right after a build run finishes, in order to prepare the environment for the next build. Note that in case of consecutive builds, we don’t save that much time, as we can’t prespawn the containers.
Caching application dependencies
Installing the application dependencies for a big project takes quite some time to be completed. One of the pros of updating the master container each night is that we ensure that all daily dependencies will be met, and as a result the new LXC clones will also contain those dependencies. The problem with this approach though, comes with dependencies introduced during the day; a new Gem for example, will spin bundle installs on all consecutive builds, which may add notable delays to our process, in the order of minutes.
To save that time, we’ve created a dedicated bundler caching service to handle the management of the application Gems. Based on a hash produced by the respective Gemfile and Gemfile.lock files, we trigger a bundler build and we cache the produced bundle directory the first time it is requested. Future builds using the same dependencies will obtain the cached bundle directory using rsync. To ensure that we don’t add further delays due to the extra calls, the service is built with gevent, and managed through a systemd unit. Relying on systemd’s transactional behavior, we automatically ensure that only the first client will trigger a bundle build while the rest will wait until the build is ready without triggering another build for the same hash.
Speeding up the build
Another challenge for speeding up our CI environment was to efficiently schedule the test suite run. To do so, we’ve broken the test suite into smaller chunks in order to parallelize the run across the LXC containers.
The chunk size is computed depending on the execution time of each test. In order to accurately measure that time, we trigger a nightly build which runs all tests sequentially and measures their execution time. Depending on that time, our scheduling algorithm will try to split the whole test suite in equal batches across the containers. Once a container finishes its execution, it will immediately request for a new batch until the whole test suite completes its execution. Note that we do not differentiate the tests on Ruby or JS specs during the scheduling procedure. All tests are considered equal and are scheduled exclusively by their execution time from the nightly build. We have completely separated the spec running logic from the spec scheduling logic. Specific spec aware classes (JS, RSpec) know how to handle the batches of specs they receive (run the specs, parse the results, and so forth).
In addition to splitting the specs into equal batches there are a couple of OS optimizations we found to help on increasing the speed of our build. A first optimization was to take advantage of Linux cgroups. Using the cpuset subsystem and specifically the cpuset.cpus parameter, we explicitly specify the cores that an LXC container is allowed to access in order to effectively pin the containers to their parent’s cores. By ensuring that no containers will run on the same core we achieve to save an important amount of time on our build due to less migrations between the cores on the host server. I/O-wise, we use tmpfs for services that need to access disk, as our testing databases (MySQL, MongoDB, ES), gaining I/O speed and predictability, as each process starts with fresh databases. Also, effectively cleaning up those dbs between the spec batch runs, decreased our build time significantly.
Auxiliary tools
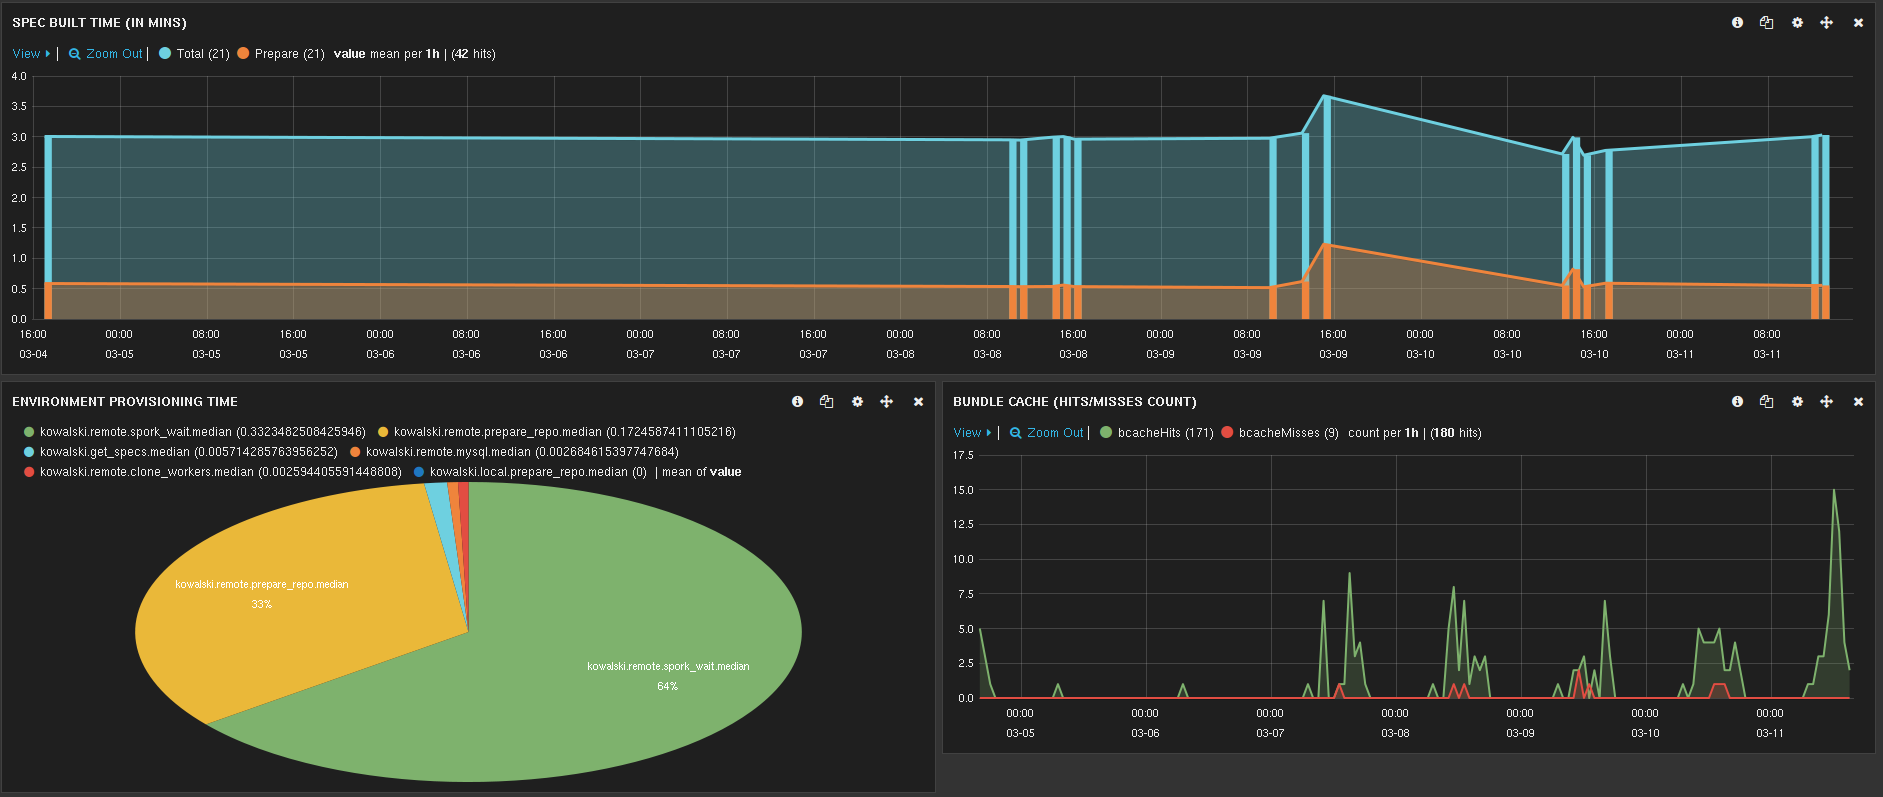
Besides the optimizations regarding to our continuous integration setup, we’ve also developed a bunch of tools to help us monitor better the overall build time and its stages. We used statsd for timing each phase of the CI stack and Kibana to visualize and identify delays and bottlenecks in our CI workflow.
Additionally to the above, we developed a test-bed for measuring and comparing different scheduling algorithms and for choosing the most efficient strategy for splitting our test suite into smaller chunks. We should also consider the exact time that our tests need to run atomically. We needed to find any problematic specs and try to improve them, or maybe split them in smaller chunks, if possible, as an attempt to not maintain too divergent specs. A tool that gathers the most time consuming specs during the day helped us work towards that direction. Finally, we developed a tool to help our developers easily reproduce failing Heisenspecs (or Heisenbugs). By those terms we mean specs that are not well defined, and succeed or fail randomly, probably affected by the load stress of the machine or the execution order of the specs. To be able to reproduce that randomness, we track the exact spec batch with the specific seed that produced the error. It has been proved very handy in our day-to-day operations to quickly resolve such failures as soon as they appear.
Hardware used
For our continuous integration needs we maintain a hardware cluster, consisting of 3 physical servers with 32 GB RAM and 2 cpus x 6 cores x 2 threads each. We average on 12 containers per server, pinned at specific, non-overlapping cores.
Summing up & future enhancements
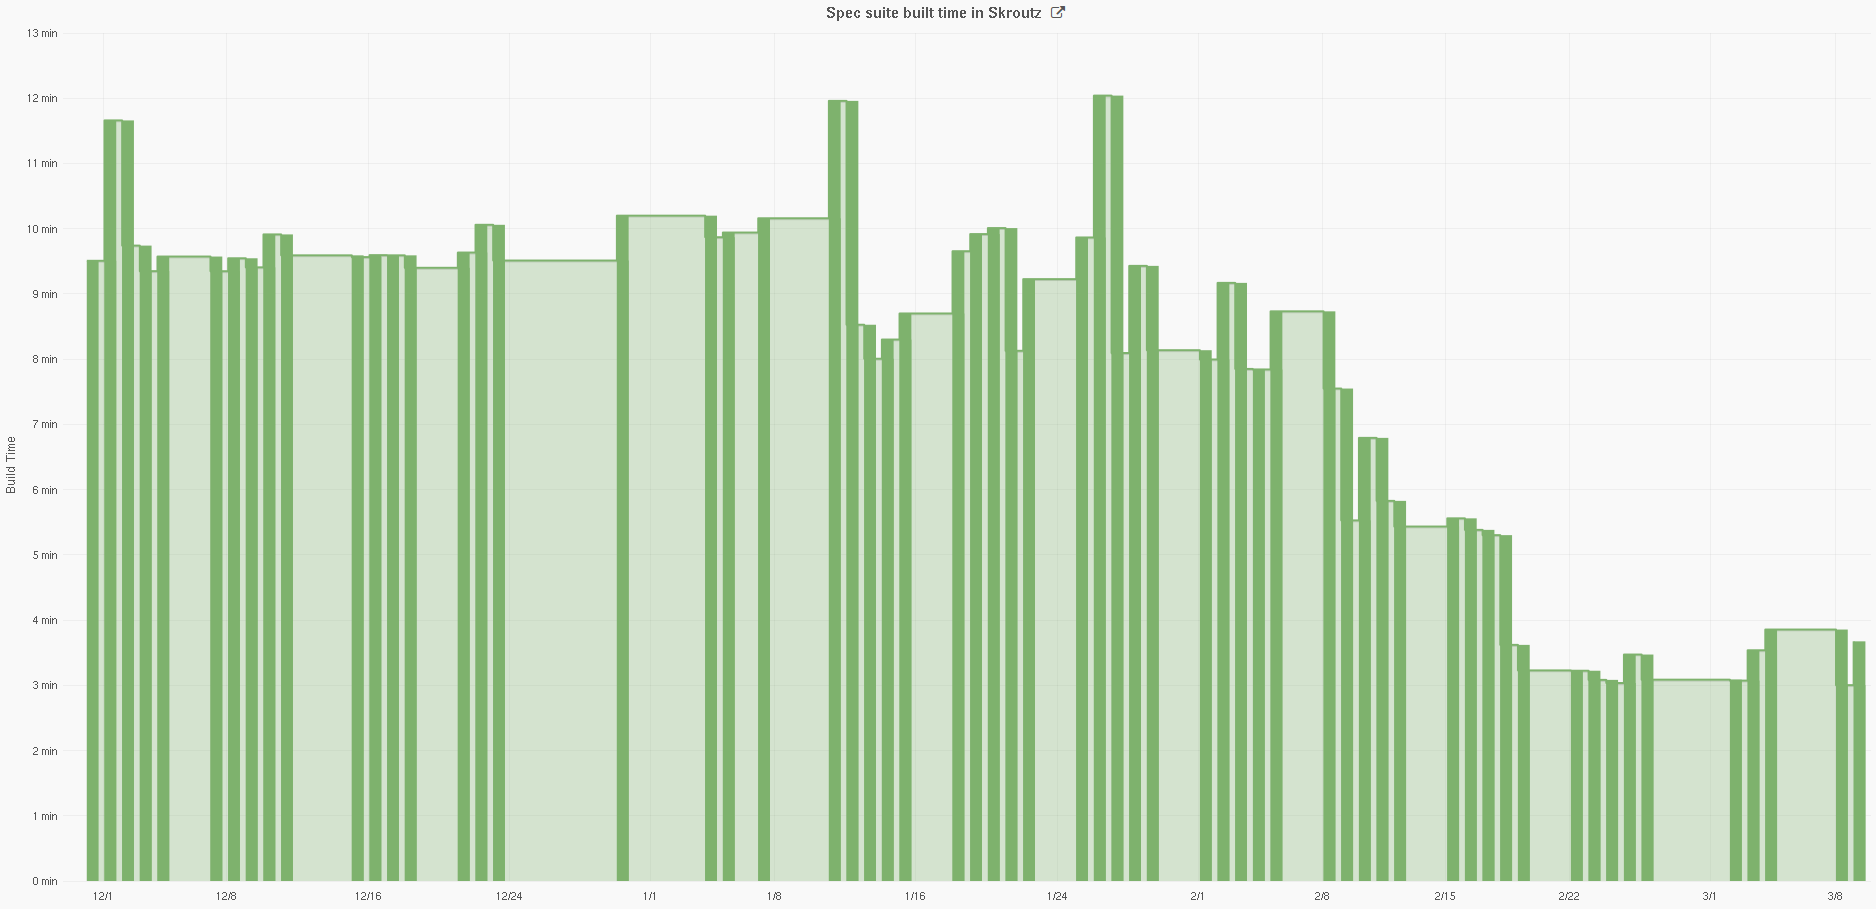
Couple of months ago, a full test suite run took about 10 minutes to complete, which resulted in heavy congestion in the Jenkins build queue. Today, with almost the same test suite in size, a full test run averages in less than 3 minutes with our latest optimizations.
Below we attach a diagram of the evolution of our build time during the last three months. We can easily observe how the overall build time duration decreases as we deploy the beforementioned optimizations (bundle-cache service, environment provisioning, and so forth).
As our code base keeps growing, our CI workflow will certainly need to evolve, together with our spec suite. Our main target is to keep the build time stable and independent of the specs’ size, and even decrease it if it’s possible. Some extra thoughts that could be implemented in a future iteration include:
- Support for multiple build queues that could run in parallel.
- Spawn one-off containers for unit-test development needs.