Except from the main product, Skroutz provides various internal tools to its people. These tools are developed in-house and are highly customized for our specific needs. One of these tools provides its users with statistics related to orders. Let’s refer to this page as the statistics page from now on.
The problem
The statistics page is rendered using React and is responsible for getting specific data from the backend and display them through various charts to the end user. The problem is that all required data come from a unique database query which is quite heavy and takes some time to finish (it depends on the requested period of time and number of shops) on the one hand and, on the other hand, the way React handles this waiting.
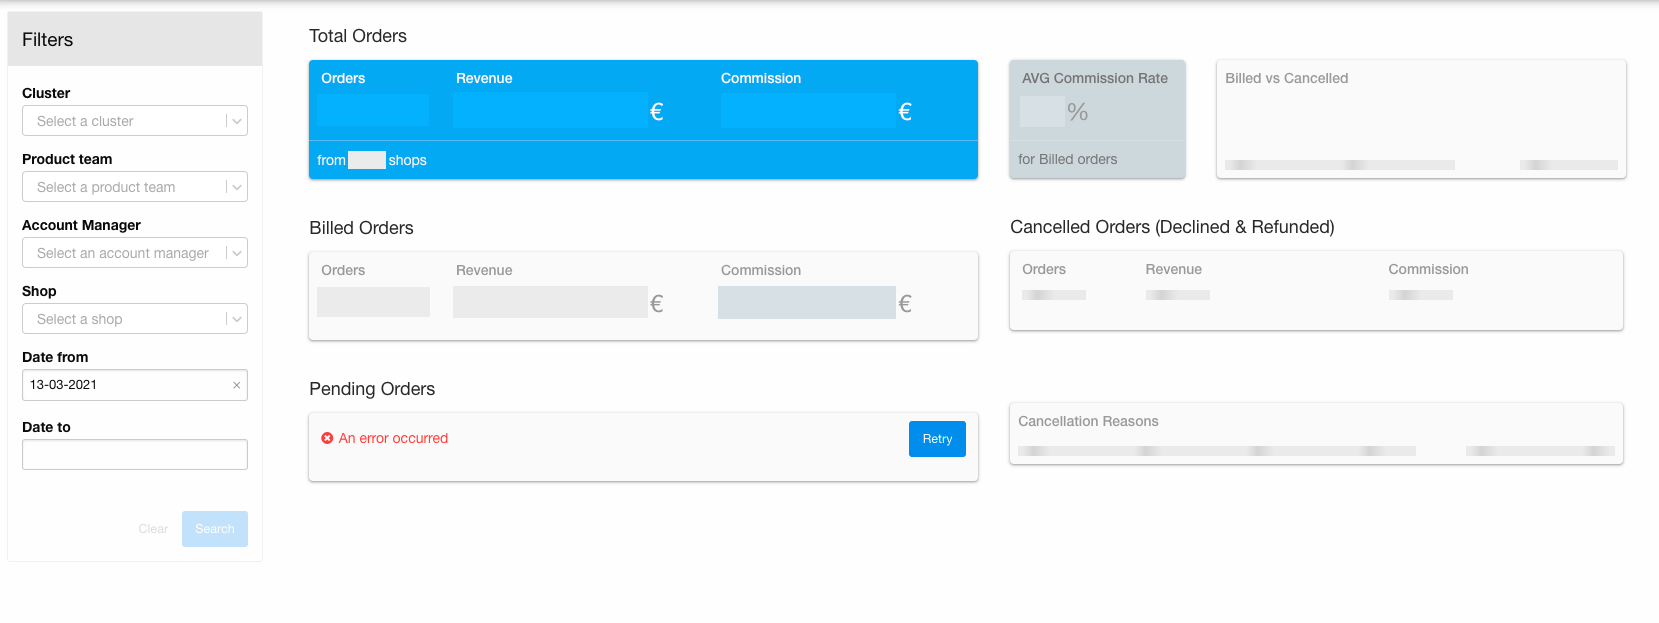
The following image shows what user sees while waiting for the page to finish loading.
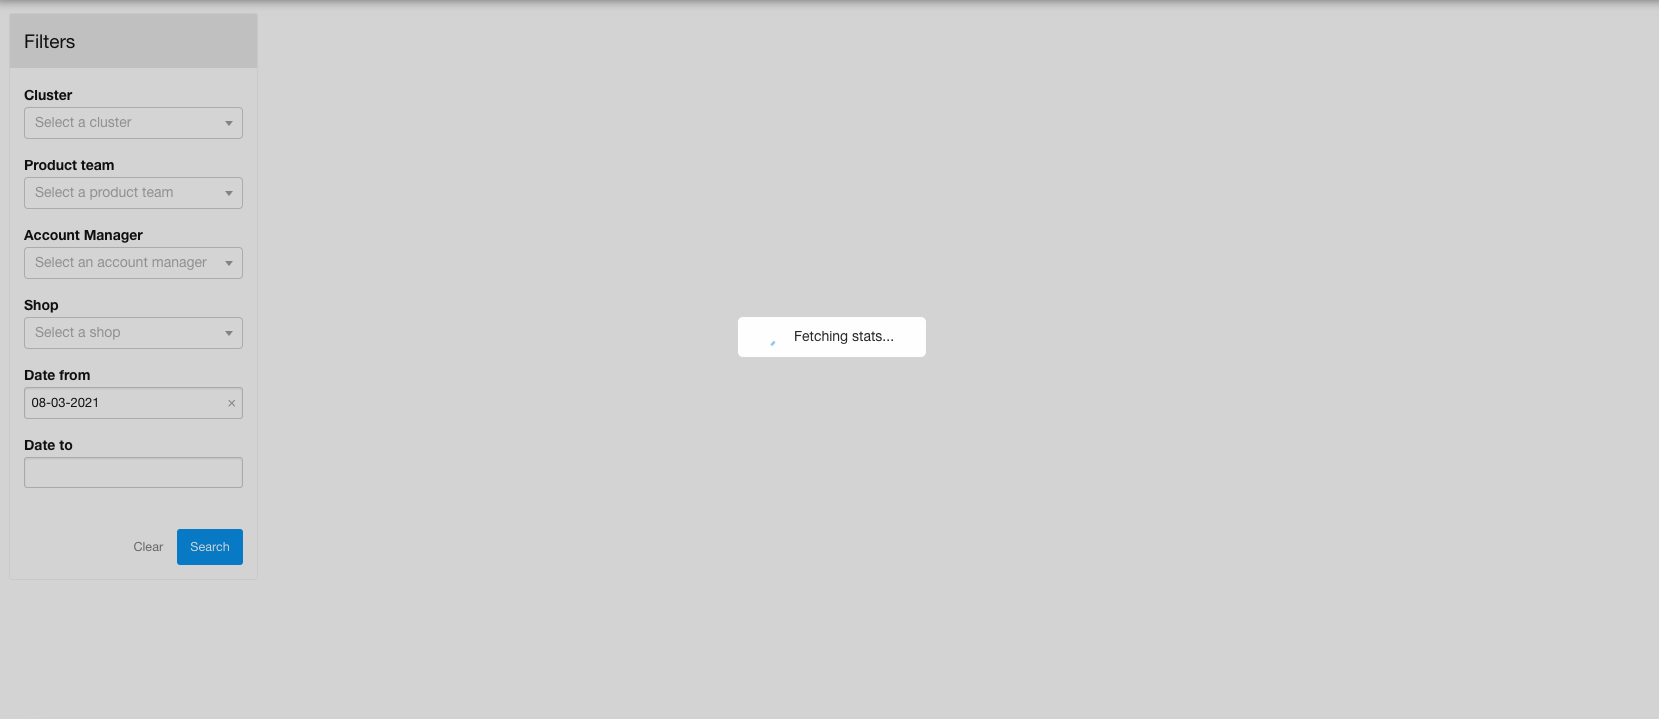
This is not the best user experience because we have to wait for all data to be available before React starts to render the children components that are going to display the desired data. Furthermore, there is too much blank space on the screen while page loads.
The following illustration depicts the way that the current implementation is organized. Each solid-lined rectangle represents a React component and each arrow represents data that flow from one component to another.
There is a wrapper component (the outer rectangle) that is responsible for fetching the data from the backend. Inside the wrapper component there is another component (the intermediate rectangle) that holds various children components (the colored rectangles) which are going to display the respective data.
When the data are available, the wrapper component updates its internal state and all children components get re-rendered because we pass the data as props to each one of them through the intermediate component.
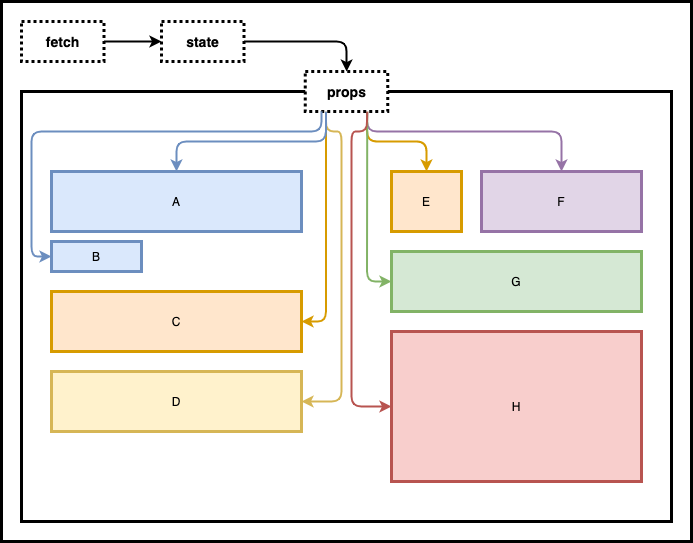
The components are colored this way on purpose. Different color means different data. We can see that some components request different data from each other, but others, like A and B, or C and E, request the same data, only they display them in a slightly different way.
Proposed solution
As mentioned before, the main problem with the initial implementation is the fact that React waits for a heavy query to finish in order to return all the required data.
What if each component requests their own data independently from the backend? We could split the one heavy query to smaller ones that would get called from the respective components. We may end up with multiple network requests instead of one, but we can render each component as soon as it has its data available.
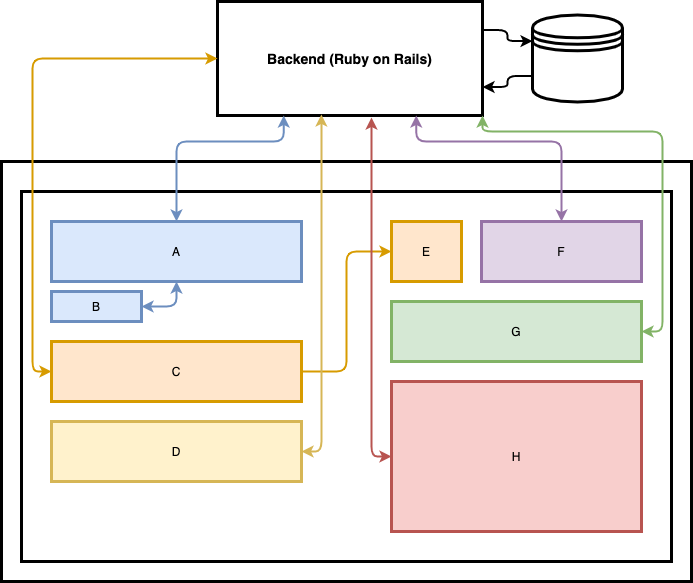
What do we want to achieve with these changes?
- Better user experience, because the user will see various components in a loading state (instead of a full page loader) and, gradually, each one of them will render the respective chart, as soon as it gets its data. This is a valid benefit here because the nature of the specific page is to provide various, independent metricts that can be consumed individually by the user and provide a valuable insight. In other words, the user doesn’t have to view all the data that the page, eventually, will render in order to extract a conclusion.
- Avoiding single point of failure, by executing multiple requests, we avoid the case when a failed request prevents all the components to be rendered, leaving a black page with an error message. With multiple, independent components we can render the ones that have data, while in the ones where an error has occurred, we can render an error message with a retry button.
Implementation
Now let’s move on with the implementation. We are not going to dive into much detail here and we are not going to provide the full code as this is not the goal of this article. The purpose of this article is to highlight the most interesting parts of the current implementation and briefly explain the changes we made to achieve the final result.
Names of classes, methods and components may have changed. Many parts of code have been omitted for reasons of simplicity.
Create the API
First of all we have to provide the API that the React components are going to use in order to fetch their data. Until now, we had an endpoint that, as soon as it gets called, it executes a heavy query to the database in order to return a hash containing all the required data.
# GET /path/to/stats_data
def stats_data
  render json: DataClass.new(
    from: params[:from],
    to: params[:to]
  ).stats
end
After adding the appropriate methods to DataClass in order to return the respective portion of data, we make stats_data action to accept the metric param in order to be able to call the respective DataClass method.
# GET /path/to/stats_data
def stats_data
  data_summary = DataClass.new(
    from: params[:from],
    to: params[:to]
  )

  data = {}
  data[params[:metric]] = data_summary.public_send(params[:metric])

  render json: data
resque => e
  respond_error(e, :unprocessable_entity)
end
Now, each component will be able to call stats_data, providing its own metric param to get the desired data.
How it used to work initially
Let’s take a look at the initial state. There are two wrapper components, Stats and StatsMetrics as we saw in image 2. Stats component fetches the data and passes them to StatsMetrics, as we can see in the following snippet.
export default function Stats({ options }) {
  const [searchUri, setSearchUri] = useState(null);
  const [statsData, setStatsData] = useState(null);
  ...
  useEffect(() => {
    if (!shouldFetchStats) return;

    getStats(searchUri)
      .then((data) => setStatsData(data))
      .catch((error) => { ... })
  }, [shouldFetchStats, searchUri]);

  return (
    <>
      ...
      <div>{statsData && <StatsMetrics data={statsData} />}</div>
    </>
  );
}StatsMetrics, on its turn, gets the data from its parent and renders the children components, passing the respective data to each one of them. You can see a comment after each component that indicates the respective rectangle from image 2 (and 3).
As we explained earlier, some components require the same data as other components do, like component A, which requires data.order.all, just like component B does. The same goes for components C and E which require the data.order.billed part.
export default function StatsMetrics({ data }) {
  return (
    <>
      <StatsOrderGroup data={data.orders.all} /> /* A */
      <StatsOrderCountLine order={data.orders.all} /> /* B */
      <StatsOrderGroup data={data.orders.billed} /> /* C */
      <StatsOrderGroup data={data.orders.pending_billing} /> /* D */
      <StatsAverageGroup data={data.orders.billed} /> /* E */
      <StatsRatiosGroup data={data.ratios} /> /* F */
      <StatsOrderGroup data={data.orders.cancelled} /> /* G */
      <CancellationGroup data={data.cancellation_per_reason} /> /* H */
    </>
  );
}
Taking a look at one of the children components, let’s say StatsOrderGroup, we can see that it takes the data prop and displays parts of the data object via helper components.
export default function StatsOrderGroup({ data }) {
  return (
    <>
      <StatsQuantityMetric value={data.count} />
      <StatsCurrencyMetric value={data.revenue} />
      <StatsCurrencyMetric value={data.commission} />
    </>
  )
}
Move responsibility of data fetching to children components
As we explained in the previous section, the plan is to assign the responsibility of data fetching to each one of the children components. So, the first step is to remove the useEffect hook from the Stats component and pass the searchUri prop to StatsMetrics component, instead of statsData.
export default function Stats({ options }) {
  const [searchUri, setSearchUri] = useState(null);
  // const [statsData, setStatsData] = useState(null);
  ...
  // useEffect(() => {
  //   if (!shouldFetchStats) return;

  //   getStats(searchUri)
  //     .then((data) => setStatsData(data))
  //     .catch((error) => { ... })
  // }, [shouldFetchStats, searchUri]);

  return (
    <>
      ...
      {/* <div>{statsData && <StatsMetrics data={statsData} />}</div> */}
      <div>
        {searchUri !== null && <StatsMetrics searchUri={searchUri} />}
      </div>
    </>
  );
}
Then, we change the StatsMetrics component to receive the searchUri prop in order to pass it to the children components.
export default function StatsMetrics({ searchUri }) {
  return (
    <>
      <StatsOrderGroup searchUri={searchUri} />
      <StatsOrderCountLine order={searchUri} />
      <StatsOrderGroup searchUri={searchUri} />
      <StatsOrderGroup searchUri={searchUri} />
      <StatsAverageGroup searchUri={searchUri} />
      <StatsRatiosGroup searchUri={searchUri} />
      <StatsOrderGroup searchUri={searchUri} />
      <CancellationGroup searchUri={searchUri} />
    </>
  );
}
We need a loading state and error reporting
Until now, children components got rendered if and only if they had their data available. Their parent was passing the data to them and they were ready to render their markup.
Now, the situation is different. Each child component gets rendered immediately on page load and it waits until it has its data available from the backend in order to display them to the user.
So, we need to have a loading state for each component and an error reporting state in case of an error response from the api call. For this reason, we have introduced some wrapper components that are responsible for the following:
- Fetch data from the backend
- Render a loading state while waiting for data to be available
- Display an error message in case of error, and a retry button (for on-demand data fetching)
Introducing children components wrappers
We are going to need a wrapper for each component that needs to fetch its data, so we create three wrappers:
StatsOrderGroupWrapperforStatsOrderGroupStatsRatiosGroupWrapperforStatsRatiosGroupCancellationGroupWrapperforCancellationGroup
We did not create wrappers for StatsOrderCountLine and StatsAverageGroup because these components will get their data, indirectly from other components (pairs A - B and C - E).
The following snippet shows the StatsOrderGroupWrapper component in its final form. This component (wrapper) fetches the data it needs and it renders a loading state while waiting and displaying the data as soon as they are available, or displays an error message in case of unsuccessful fetch.
import { getStats } from 'path/to/api';
import { useGetCpsOrderStats } from 'path/to/useGetCpsOrderStats';
import { useCpsOrdersStats } from 'path/to/cpsOrdersStatsContext';

export default function StatsOrderGroupWrapper({ searchUri, metric, updateRequestsState }) {
  const initialStats = {
    count: 0,
    revenue: 0,
    commission: 0
  };
  const { dispatch } = useCpsOrdersStats();
  const { stats, isLoading, showError, getData } = useGetCpsOrderStats({
    getStats,
    searchUri,
    metric,
    initialStats,
    dispatch
  });

  useEffect(() => {
    updateRequestsState(metric, isLoading);
  }, [updateRequestsState, metric, isLoading]);

  return showError ? (
    <StatsErrorSection errorMessage={stats.error} retryFunc={getData} />
  ) : (
    <StatsOrdersGroup isLoading={isLoading} data={stats} />
  );
}
As you can see, all the functionality is delegated to two custom hooks, useGetCpsOrderStats and useCpsOrdersStats. The other two wrappers use the same hooks and are similarly organized.
Let’s see what’s going on inside cpsOrdersStatsContext which exposes the useGetCpsOrderStats hook alongside with another two context components that we are going to see later in action:
const initialStats = {
  all: null,
  billed: null
};

const CpsOrdersStatsContext = React.createContext(initialStats);

function cpsOrdersStatsReducer(state, { type, payload }) {
  switch (type) {
    case 'SET_ALL': {
      return {
        ...state,
        all: payload
      };
    }
    case 'SET_BILLED': {
      return {
        ...state,
        billed: payload
      };
    }
    case 'RESET_ALL': {
      return {
        ...state,
        all: null
      };
    }
    case 'RESET_BILLED': {
      return {
        ...state,
        billed: null
      };
    }
    default: {
      return state;
    }
  }
}

function CpsOrdersStatsProvider({ children }) {
  const [stats, dispatch] = React.useReducer(cpsOrdersStatsReducer, initialStats);
  const value = React.useMemo(
    () => ({
      stats,
      dispatch
    }),
    [stats]
  );

  return <CpsOrdersStatsContext.Provider value={value}>{children}</CpsOrdersStatsContext.Provider>;
}

function CpsOrdersStatsConsumer({ children }) {
  return (
    <CpsOrdersStatsContext.Consumer>
      {(context) => {
        if (context === undefined) {
          throw new Error(
            'CpsAllOrdersStatsConsumer should be used inside a CpsAllOrdersStatsProvider'
          );
        }
        return children(context);
      }}
    </CpsOrdersStatsContext.Consumer>
  );
}

function useCpsOrdersStats() {
  const context = React.useContext(CpsOrdersStatsContext);
  if (context === undefined) {
    throw new Error('useCpsAllOrdersStats should be used inside a CpsAllOrdersStatsProvider');
  }
  return context;
}

export { CpsOrdersStatsProvider, CpsOrdersStatsConsumer, useCpsOrdersStats };
First of all we create a context object and store it in the CpsOrdersStatsContext constant.
After that, we declare the cpsOrdersStatsReducer function that we are going to use as a reducer inside CpsOrdersStatsProvider component, which we create immediately after.
What CpsOrdersStatsProvider does is that it provides a value to its children components, notifying them about changes and providing the dispatch function in order for them to update the context state.
But, in order for CpsOrdersStatsProvider’s children components to be informed about changes in our context (the stats data), they need to be wrapped inside a context consumer component. For this reason we create the CpsOrdersStatsConsumer component, which does exactly that.
Finally, we create the useCpsOrdersStats custom hook to be used by our wrappers (like StatsOrderGroupWrapper) in order to have access to our context, and especially the dispatch function. StatsOrderGroupWrapper calls the dispatch function (through useGetCpsOrderStats hook) every time it needs to inform its siblings components that it has the data they need.
Now let’s take a look at the contents of useGetCpsOrderStats:
import { useState, useCallback, useEffect } from 'react';
import camelCase from 'lodash/camelCase';

const useGetCpsOrderStats = ({ getStats, searchUri, metric, initialStats, dispatch = null }) => {
  const [stats, setStats] = useState(initialStats);
  const [isLoading, setIsLoading] = useState(false);
  const [count, setCount] = useState(0);

  const dispatchCallback = useCallback(
    (payload) => {
      if (dispatch && (metric === 'all' || metric === 'billed')) {
        dispatch({ type: `SET_${metric.toUpperCase()}`, payload });
      }
    },
    [dispatch, metric]
  );

  const getCpsOrderStats = useCallback(
    (isMounted) => {
      if (metric && searchUri !== null) {
        if (dispatch) {
          dispatch({ type: `RESET_${metric.toUpperCase()}` });
        }
        setIsLoading(true);
        getStats(searchUri, metric)
          .then((data) => {
            if (isMounted) {
              const thisData = data[camelCase(metric)];
              setStats(thisData);
              dispatchCallback(thisData);
              setIsLoading(false);
            }
          })
          .catch((e) => {
            if (isMounted) {
              const errorMessage = (e.response || {}).statusText || 'An error occurred';
              const errorData = { error: errorMessage };
              setIsLoading(false);
              setStats(errorData);
              dispatchCallback(errorData);
            }
          });
      }
    },
    [getStats, dispatch, metric, searchUri, dispatchCallback]
  );

  const getData = () => {
    setCount(count + 1);
  };

  useEffect(() => {
    let mounted = true;

    getCpsOrderStats(mounted);

    return () => {
      mounted = false;
    };
  }, [getCpsOrderStats, count, searchUri]);

  const showError = !isLoading && (!stats || stats.error !== undefined);

  return { stats, isLoading, showError, getData };
};

export { useGetCpsOrderStats };
In this custom hook we keep the logic of fetching the desired data (metric), update the stats context by calling the dispatch function for the specified metric and define the loading state and if we need to show an error message or not.
Prevent new requests until all components have finished loading
There are two buttons under the stats page filters, Search and Clear buttons. Every time we click on each one of them, all components should request their data again. We need to prevent the user from clicking either of those buttons until all components have finished loading their data. Otherwise, we might end up having multiple asynchronous requests to compete with each other from which one will finish first.
For this reason we introduce the LoadingInspectionContext, which is responsible for keeping the loading state of the whole page, in other words, it checks to see if there is at least one component in the page that still waits for its request to finish.
const LoadingInspectionContext = React.createContext({});

function atLeastOneIsPending(collection) {
  return Object.entries(collection).some((x) => x[1] === true);
}

function LoadingInspectionProvider({ children }) {
  const [requests, setRequests] = useState({});
  const [isLoading, setIsLoading] = useState(false);

  const updateRequest = useCallback((metric, metricIsLoading) => {
    setRequests((r) => ({ ...r, [metric]: metricIsLoading }));
  }, []);

  const value = React.useMemo(
    () => ({
      isLoading,
      requests,
      updateRequestsState: updateRequest
    }),
    [updateRequest, requests, isLoading]
  );

  useEffect(() => {
    setIsLoading(atLeastOneIsPending(requests));
  }, [requests]);

  return (
    <LoadingInspectionContext.Provider value={value}>{children}</LoadingInspectionContext.Provider>
  );
}

function LoadingInspectionConsumer({ children }) {
  return (
    <LoadingInspectionContext.Consumer>
      {(context) => {
        if (context === undefined) {
          throw new Error(
            'LoadingInspectionConsumer should be used inside a LoadingInspectionProvider'
          );
        }
        return children(context);
      }}
    </LoadingInspectionContext.Consumer>
  );
}

export { LoadingInspectionProvider, LoadingInspectionConsumer };
As we can see, we expose the LoadingInspectionProvider and LoadingInspectionConsumer components from the above file. The way we use these goes like this: we wrap the filters and the main page (that contains the stats components) with a LoadingInspectionProvider. Then, we wrap each one of the wrapper components (the components that fetch the data) with a LoadingInspectionConsumer. When a stats component’s data are available, we call the updateRequestsState function that is provided by the context object of the LoadingInspectionConsumer components, in order to update the page’s loading state.
Combining them all together
Now, let’s see how all the above work together.
export default function Stats({ options }) {
  const [searchUri, setSearchUri] = useState(null);

  const searchCallback = useCallback(({ queryString }) => {
    setSearchUri(queryString);
  }, []);

  return (
    <LoadingInspectionProvider>
      <StatsFilters OnSearchCallback={searchCallback} />
      <div>
        {searchUri !== null && <StatsMetrics searchUri={searchUri} />}
      </div>
    </LoadingInspectionProvider>
  );
}
As we said earlier, LoadingInspectionProvider wraps the filters and the StatsMetrics components. If we take a look inside the StatsMetrics component, we can see how we use the LoadingInspectionConsumer and the CpsOrdersStatsProvider and CpsOrdersStatsConsumer components.
import { CpsOrdersStatsProvider, CpsOrdersStatsConsumer } from 'path/to/cpsOrdersStatsContext';
import { LoadingInspectionConsumer } from 'path/to/loadingInspectionContext';

export default function StatsMetrics({ searchUri }) {
  return (
    <CpsOrdersStatsProvider>

      /* A */
      <LoadingInspectionConsumer>
        {({ updateRequestsState }) => (
          <StatsOrderGroupWrapper
            searchUri={searchUri}
            metric="all"
            updateRequestsState={updateRequestsState}
          />
        )}
      </LoadingInspectionConsumer>

      /* B */
      <CpsOrdersStatsConsumer>
        {(context) => {
          const {
            stats: { all }
          } = context || { stats: {} };
          return <StatsOrderCountLine metric={all} />;
        }}
      </CpsOrdersStatsConsumer>

      /* C */
      <LoadingInspectionConsumer>
        {({ updateRequestsState }) => (
          <StatsOrderGroupWrapper
            searchUri={searchUri}
            metric="billed"
            updateRequestsState={updateRequestsState}
          />
        )}
      </LoadingInspectionConsumer>

      /* D */
      <LoadingInspectionConsumer>
        {({ updateRequestsState }) => (
          <StatsOrderGroupWrapper
            searchUri={searchUri}
            metric="pending_billing"
            updateRequestsState={updateRequestsState}
          />
        )}
      </LoadingInspectionConsumer>

      /* E */
      <CpsOrdersStatsConsumer>
        {(context) => {
          const {
            stats: { billed }
          } = context || { stats: {} };
          return <StatsAverageGroup billed={billed} />;
        }}
      </CpsOrdersStatsConsumer>

      /* F */
      <LoadingInspectionConsumer>
        {({ updateRequestsState }) => (
          <StatsRatiosGroupWrapper
            searchUri={searchUri}
            metric="ratios"
            updateRequestsState={updateRequestsState}
          />
        )}
      </LoadingInspectionConsumer>

      /* G */
      <LoadingInspectionConsumer>
        {({ updateRequestsState }) => (
          <StatsOrderGroupWrapper
            searchUri={searchUri}
            metric="cancelled"
            updateRequestsState={updateRequestsState}
          />
        )}
      </LoadingInspectionConsumer>

      /* H */
      <LoadingInspectionConsumer>
        {({ updateRequestsState }) => (
          <CancellationGroupWrapper
            searchUri={searchUri}
            metric="cancellation_reasons"
            updateRequestsState={updateRequestsState}
          />
        )}
      </LoadingInspectionConsumer>

    </CpsOrdersStatsProvider>
  );
}
To sum up, we can say that the flow goes something like this:
- Wrapper components (like
StatsOrderGroupWrapper) render with a loading state enabled useGetCpsOrderStatsrequests the data- When the data are available, the
dispatchmethod is called in order to update the context - The component’s loading state becomes
false - The wrapper notifies the
LoadingInspectionProvidercontext component that it has finished loading its data - The stats contexts has been updated, so
CpsOrdersStatsConsumers notify their children to render the desired data
Final result
It is time to take a look at our final result. As soon as the document loads, each component sends a request to the backend and renders a placeholder, indicating that it waits for its data to be available. Now, the user can have a better idea of what this page is going to render.
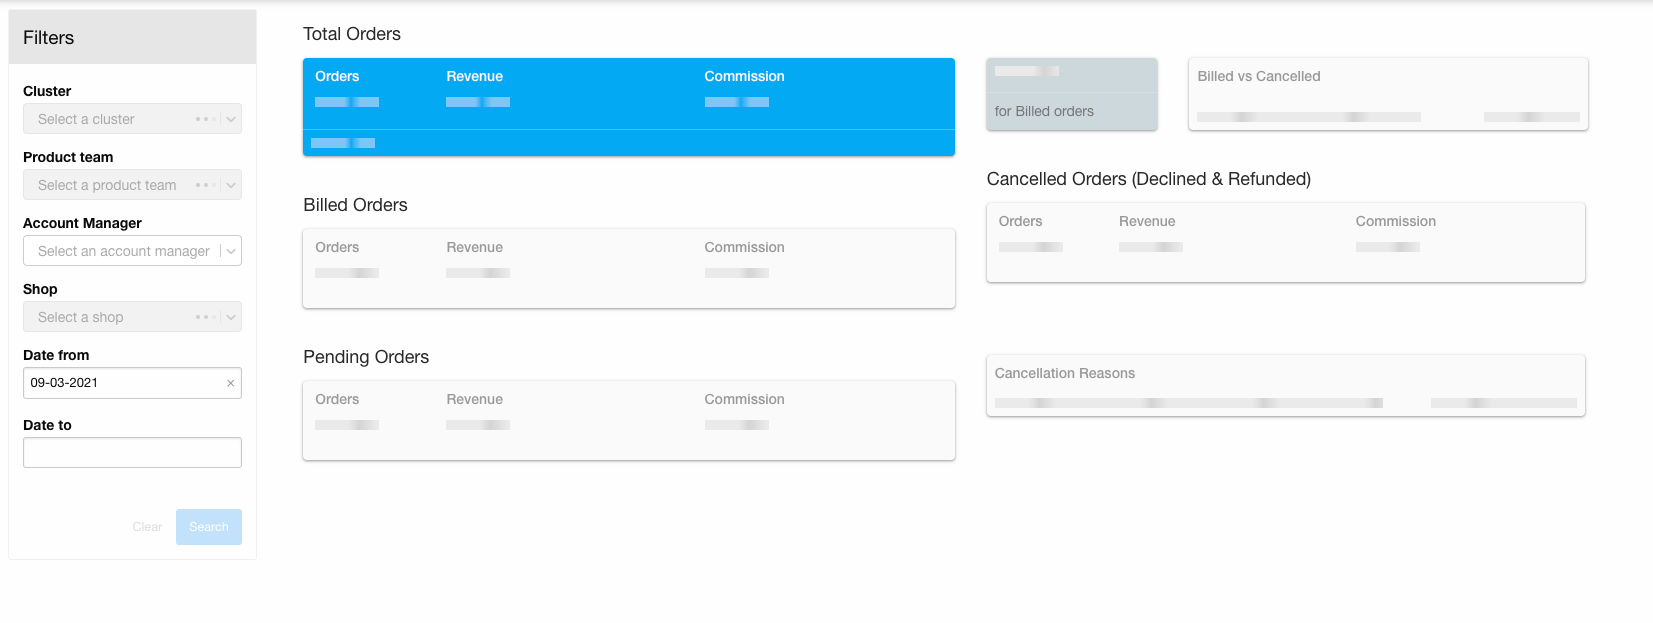
In case of unexpected error in a specific component, an error message gets rendered alongside with a retry button that gives the user the opportunity to request the data for this component again. The other components that managed to retrieve their data successfully should be able to visualize them via the respective chart.
Now let’s take a look at the network tab to figure out what has changed. The next two images illustrate the time it took for each request to be completed.
All measurements were made in development environment
In the first image we can see that, in the initial case, it took about 34 seconds for one (and ony) request to be completed.

In the second image we see that it takes about 42 seconds for all requests to be completed. Moreover, instead of 1 request, we have 6 requests that run concurrently. At first glance this does not seem so efficient, on the contrary, it seems to have made things worse.
But if we take a second look, we can see that the first request responses in less than 12 seconds. This means that in 12 seconds from the initial load, the first component renders its data. After about 5 seconds, a second component renders its own data, and so on. It seems that the page loads progressively!

Comparing the two cases, (in the first one all components render their data after 34 seconds, and in the second case each component renders its data as soon as they are available), we see that the second case provides a better user experience, even if the last component gets rendered after 42 seconds (vs 34 seconds that took in the first case).
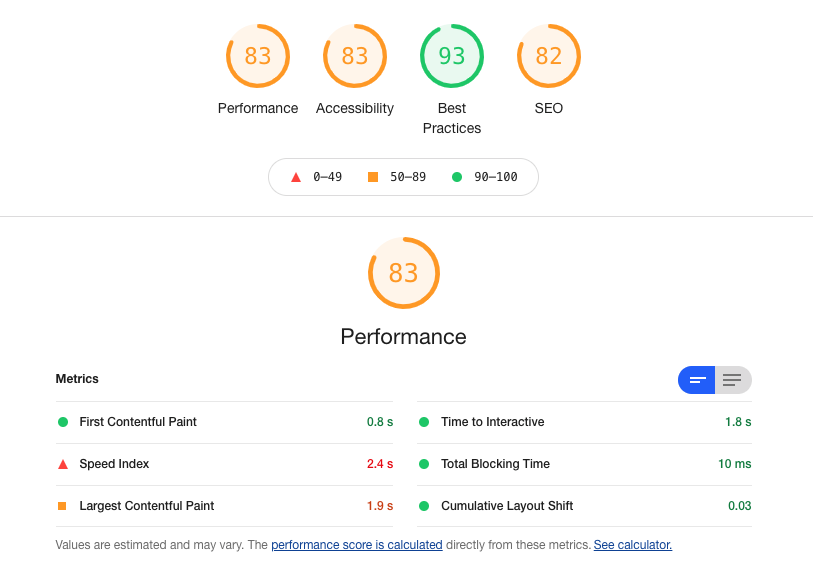
The fact that the page has finished loading the first batch of information in 12 seconds (instead of 34) reduces the TTI. As we can see in the following lighthouse report, the page starts to get interactive at 1.8 seconds.
Summary and next steps
In this post we examined the implementation of a progressive react app and we provided some technical details. We saw the use of React’s context object and how it helped us to achieve specific functionality. Finally, we presented some performance metrics and saw that the final solution is a bit slower than the initial one, but the user experience is clearly better.
But there is always room for improvement. In our case, we can implement a mechanism that would give the ability to the user to change the applied filters without having to wait for all data to get fetched. As soon as we use axios to fetch our data, we can use the CancelToken object provided by the library.
Below we can see the getStats function, the function that we call to fetch the stats data for a specific metric. getStats uses the get function which is a custom implementation of axios that we call SkroutzAxios.
It’s pretty straightforward to implement the cancellation functionality here, we just have to pass the cancelToken property to the options object.
const CancelToken = axios.CancelToken;
const source = CancelToken.source();

const httpRequest = SkroutzAxios;

function get(url) {
  return httpRequest(url, {
    method: 'GET',
    credentials: 'same-origin',
    mode: 'cors',
    cache: 'default',
    cancelToken: source.token // Provide a cancellation token
  }).then(checkStatus);
}

function getStats(searchUri = '', metric = '') {
  let endpoint = `${STATS_ENDPOINT}${searchUri}`;
  if (metric) {
    const symbol = searchUri ? '&' : '?';
    endpoint += `${symbol}metric=${metric}`;
  }
  return get(endpoint);
}
Then, we can just call source.cancel(); when we want to cancel the pending requests. For more details about the usage of CancelToken visit the axios docs.
Finally, as we can see from the previous performance report, we can take some actions in order to improve the overall score:
- Reduce the initial server response time because React waits for the document to get served in order to start fetching the data
- Remove potential unused javascript because they affect the network activity
- Eliminate render-blocking resources and deliver non-critical assets asynchronously
